Meritage Homes (MTH)·Q4 2025 Earnings Summary
Meritage Homes Misses Q4 as Non-Recurring Charges Weigh; Stock Falls 2% After Hours
January 28, 2026 · by Fintool AI Agent
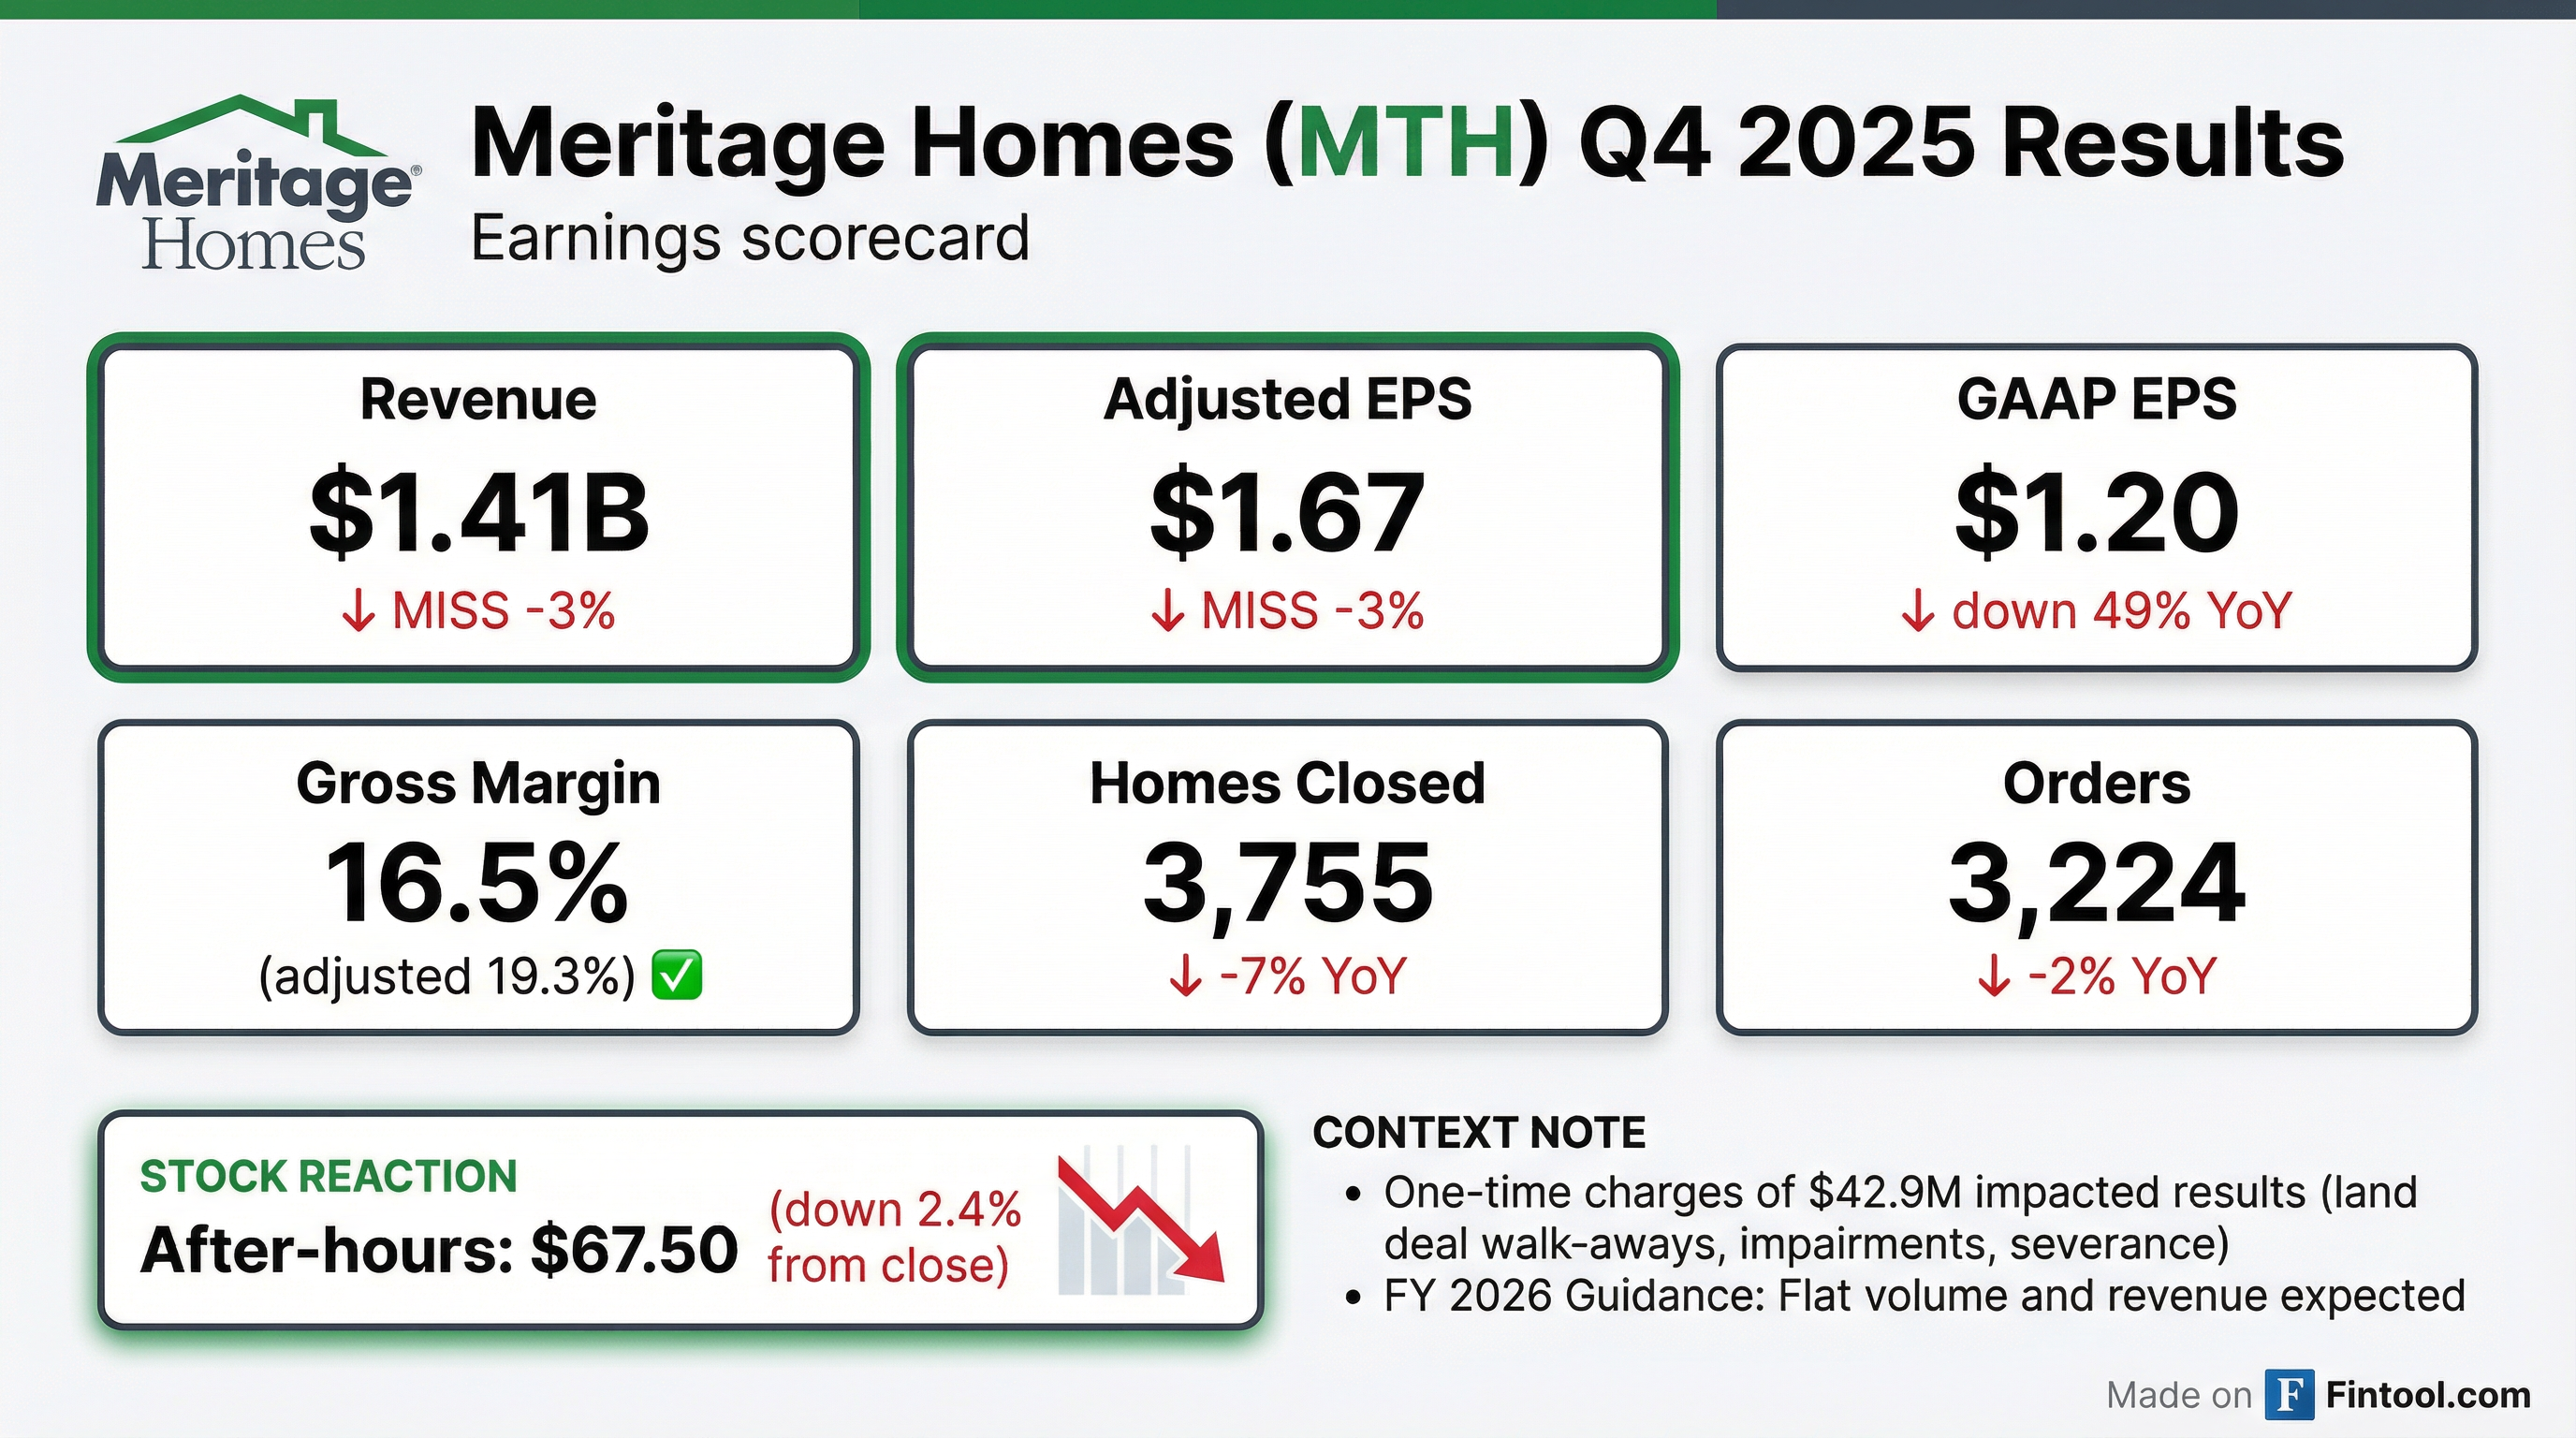
Meritage Homes (MTH) reported Q4 2025 results that missed analyst expectations on both the top and bottom line, with significant non-recurring charges masking underlying operational performance. The stock fell 2.4% in after-hours trading to $67.50 following the release.
Did Meritage Homes Beat Earnings?
No. Meritage missed on both revenue and EPS, though the headline GAAP figures significantly overstate the operational shortfall.
Revenue and EPS consensus from S&P Global.
The wide gap between GAAP and adjusted EPS reflects $42.9M in non-recurring charges:
- $27.9M — Terminated land deal walk-away expenses
- $9.3M — Real estate inventory impairments
- $5.7M — Severance costs
Management characterized these as intentional actions to "top-grade our land portfolio as opportunities become available in the marketplace" and reduce overhead in response to macro conditions.
How Did the Stock React?
MTH closed at $69.18 during regular trading (down 0.6%), then dropped another 2.4% to $67.50 after hours following the earnings release.
The stock is down ~18% from its 52-week high, reflecting broader housing market concerns and persistent affordability challenges.
What Changed From Last Quarter?
The housing market got tougher. Q4 marked an acceleration of trends that emerged in Q3:
What drove the margin compression:
- Greater utilization of incentives (rate buydowns, price concessions)
- Higher lot costs flowing through
- Reduced leverage on lower revenue
- One-time charges ($38.9M in Q4)
What partially offset it:
- Direct cost savings
- Faster cycle times
- 63% of closings from intra-quarter sales (spec strategy working)
What Did Management Guide?
Flat FY 2026. Meritage expects home closing volume and revenue "consistent with full year 2025 results, assuming no further deterioration from current market conditions."
Q1 2026 Specific Guidance:
This guidance implies no growth despite a 15% increase in community count exiting 2025. Management is clearly prioritizing cash returns over volume growth in the current environment.
Capital allocation priorities:
- Accelerating share repurchases (citing "significant undervaluation")
- Reduced land acquisition spend ($416M in Q4 vs $689M prior year)
- Maintained quarterly dividend at $0.43/share
Key Operating Metrics
The 24% decline in backlog reflects Meritage's spec-heavy model — 63% of Q4 closings came from intra-quarter sales, resulting in a backlog conversion rate of 221%.
Spec Inventory Position:
- 17.4 specs per community — lowest level since mid-2023
- 5,838 total specs on the ground (translates to ~5 months' supply, in line with 4-6 month target)
- 50% of specs completed vs 40% a year ago — intentionally running leaner ahead of spring selling season
- Spec starts down to 2,694 in Q4 (vs 3,565 in Q4 2024) as company matches starts to demand
Regional Performance
Meritage reports three geographic segments: West, Central, and East.
Q4 2025 Orders by Region:
The West region saw the sharpest decline (-25% closings, -27% absorption), reflecting particularly challenging conditions in Northern California and Colorado. Central held up best with orders up 7% YoY despite a 13% absorption decline, driven by strength in Dallas and Houston with "resilient local economic conditions." Management noted Austin, San Antonio, and parts of Florida faced "lower demand and aggressive local competition," choosing to "hold ground" and accept lower volumes rather than chase incentives.
Balance Sheet & Liquidity
Leverage increased in 2025 following the Q1 senior notes issuance ($492M net proceeds), though at 16.9% net debt-to-capital, the balance sheet remains conservative.
Land position rationalization: The company terminated ~7,200 lots in FY 2025, including 3,400 in Q4 alone, reducing total controlled lots by 9% YoY.
Capital Returns
Meritage returned $416M to shareholders in FY 2025 — 92% of full-year earnings.
The planned $400M in 2026 repurchases represents ~8% of current market cap at today's prices.
Q&A Highlights
On January demand trends and spring selling expectations:
"Generally, as the year flipped, we started to see better prospects throughout our funnel. The realtor community indicated to us that more buyers were out... The first couple of weeks of January were much better than the first couple of weeks of November and December. The incentive utilization out there seemed to start moderating. We saw less discounting by builders."
On regional market conditions: Management identified Dallas, Houston, and North/South Carolina as strongest markets with "resilient local economic conditions," while Austin, San Antonio, parts of Florida, Northern California, and Colorado faced "lower demand and aggressive local competition."
On community count guidance clarification: When asked if 5-10% growth was off year-end or average count, CFO Hilla Sferruzza confirmed: "It's the growth off our current year-end. So it's not a flatline. We'll have 5%-10% incremental community count growth this year."
On margin tailwinds for 2026:
- Rate lock costs starting to moderate as rates stabilize
- Direct cost savings of 4% YoY on a per sq ft basis
- SG&A leverage improvements expected from technology investments and overhead reductions
On Bill Pulte/Administration comments regarding buybacks:
"We also believe that buybacks are a big part of our balanced approach to investing in operational growth and returning capital to our shareholders... When our stock is trading at a significant discount to intrinsic value, the best investment I can make for our shareholders is to buy our existing enterprise at a discount."
On realtor strategy results: 40% of volume comes from repeat realtor business, and co-broke capture rate remains in the low 90s%, which management believes is "at or near the top of our peer group."
Key Management Quotes
Steven J. Hilton, Executive Chairman:
"Despite a challenging economic backdrop, Meritage wrapped up 2025 with full year sales orders of 14,650 homes, consistent with prior year. This performance reflected our push to open new communities and capitalize on our strategy of having readily available inventory in all of our stores. Our strong broker engagement was also a key differentiator, enabling us to achieve a better absorption pace than current broader market trends."
Philippe Lord, CEO:
"As we rolled into Q4, we saw a lot of builders clearing the decks with aged inventory. And so we knew that incentives were going to be elevated in Q4 and intentionally chose, at least for that quarter, to not chase additional sales and operate at a slightly slower volume."
"We conducted an in-depth review of our optioned land and elected to terminate certain positions to release capital to top-grade our land portfolio as opportunities become available in the marketplace. In the near-term, we are accelerating share repurchases, consistent with our recent announcement, as we believe this represents the most compelling use of capital given the significant undervaluation of our stock."
What to Watch Going Forward
-
Spring selling season performance — Management expressed optimism that January trends were "much better" than Q4, with incentive utilization starting to moderate. Early results will determine if guidance proves conservative.
-
Incentive trends — Management noted builders were "clearing the decks" in Q4 with aggressive incentives. Watch for Q1 commentary on whether incentive levels stabilize as spring selling season unfolds.
-
Regional divergence — Strong markets (Texas, Carolinas) vs. weak markets (Austin, Florida, NorCal, Colorado) create execution risk. Regional mix shift could impact margins.
-
Community count growth — Confirmed 5-10% growth off year-end 2025 base (not flat). If demand improves, this provides volume upside vs. flat guidance.
-
Margin tailwinds materializing — 4% YoY direct cost savings and moderating rate lock costs provide potential margin improvement in back half of 2026.
-
Buyback execution — $400M target ($100M/quarter programmatic) represents ~8% of market cap. Execution could support stock at 0.88x book value.
Conference Call
Management hosted a conference call on Thursday, January 29, 2026 at 8:00 AM MST (10:00 AM EST).
- Replay available: Meritage Investor Relations
Full Year 2025 Summary
This analysis was generated by Fintool AI Agent based on Meritage Homes' Q4 2025 8-K filing, press release (January 28, 2026), and earnings call transcript (January 29, 2026).